What does belonging mean to you?
To feel like you belong, you need to be able to be your whole self. This means feeling accepted and included, and not feeling discriminated against or excluded.
For us to understand how to improve inclusivity in Aotearoa Te Waipounamu, we wanted to find out what it was that made people feel like they belonged. We held two runs of workshops over the motu in 2020 and in 2022.
We asked about belonging because we wanted to understand what helps people belong; what gets in the way of belonging; and find out what work is needed to create a society where everyone feels valued.
The workshops were framed on three questions:
Our approach
From February to September 2020, we met with and talked to individuals and groups across the country. Due to the restrictions caused by Covid-19, things went a little differently than planned. This meant we met with people both face-to-face and over video calls, in hui and individually. We also received submissions online through our website.
-
Our goal was to form an appropriate balance of participants across location, gender, religion, disability and other diversity. We wanted to engage with broad groups across the community. We reached out to as many organisations as possible across all categories, as noted below.
How we sourced groups and completed participant recruitment
Lists were manually collated by reviewing online sources across categories such as age, gender, sexuality, disability, health and wellbeing, religion, migration, community and personal interest groups, support networks. We then approached these groups, sending out emails and following up with phone calls.
Event information was published on our website, Facebook page and Twitter. The information we shared with national organisations was often shared to their member lists, published on their websites and in newsletters.
Participants were sourced through:
- Our engagement with groups, as noted above
- Localised website research and social media engagement
- Direct contact made after publication of press releases
- Inclusive Aotearoa Collective Tāhono volunteer lists
- Previous participant referrals.
Physical locations we visited
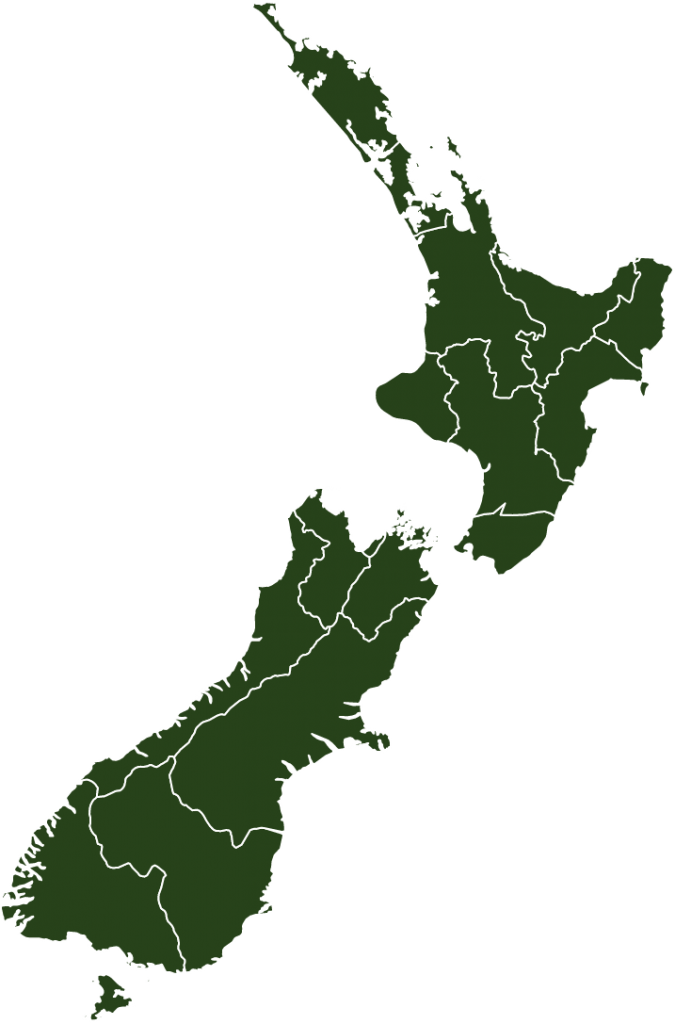
We visited 46 locations around Aotearoa New Zealand to hold face-to-face conversations with people and organisations. During lockdown we also covered these and other locations using video calls.
We visited:
- Ashburton
- Auckland
- Balclutha
- Blenheim
- Christchurch
- Cromwell
- Dargaville
- Dunedin
- Franz Josef
- Gisborne
- Gore
- Greymouth
- Hamilton
- Hastings
- Hokianga
- Hokitika
- Invercargill
- Kaikohe
- Kaitaia
- Kerikeri
- Masterton
- Motueka
- Napier
- Nelson
- New Plymouth
- Ngaruawahia
- Palmerston North
- Picton
- Queenstown
- Raglan
- Rotorua
- Taupo
- Tauranga
- Te Kuiti
- Thames
- Timaru
- Wanaka
- Wellington
- Westport
- Whakatane
- Whanganui
- Whangarei
- Woodend
-
It was important to us that we include all New Zealanders and provide an opportunity for everyone to contribute to conversations. This is for two reasons: firstly, to ensure we have a balanced understanding of people’s lived experiences; and secondly, so that we could learn how the experiences, insights and ideas from one particular group held relevance for others.
Our assumption was that there were common elements experienced in feelings of belonging (or lack thereof) across different groups and communities, and keeping the scope broad gave us an opportunity to test that assumption.
What was in scope
The strategy focuses on what people in communities and civil society tell us regarding their experience with belonging and inclusion. We were committed to listening and capturing the wide range of themes that arose from the large number of conversations planned at an individual, community and society level. Therefore, our location and engagement scope was broad, as were the approaches we took to enable participation:
- Face-to-face group and individual conversations
- Online Zoom group and individual conversations
- Major Hui in Wellington and Auckland
- Demographic data gathering for all participants
- Website survey incorporating demographic and conversation queries
- Literature Review: ‘Diversity, Belonging and Inclusion in Aotearoa New Zealand: a review of consultation and community engagement’
What was out of scope
- As the strategy did not cover activity by central and local government, participation by public sector agencies was not in scope.
- Some public servants did join conversations in a personal capacity.
-
From February to September 2020, deep inquiry conversations were held with individuals and groups across the country. A planned road trip across both the North and South Islands took in small towns, rural areas and cities, and gave our facilitators an opportunity to talk with people from all walks of life.
Much of the road trip activity was completed as planned. However, with Covid-19 impacts and Level 2 – 4 restrictions, an adaptive approach was implemented: the conversations were taken online and run via Zoom. These were well patronised and proved to be a successful approach to running conversations. Major Hui were held in Wellington and Auckland. The planned Christchurch Hui was moved online due to Covid-related event restrictions.
A website survey incorporating both quantitative and qualitative queries allowed individuals to provide opinion and experience insights in their own time.This tool was published in multiple languages and offered a voice-recorded or type-written answer option.
Event participants who requested assistance were supported with accessibility and communication options to enable them to fully partake in conversations.
Conversation participants were asked to complete a consent and survey form (either online or in paper format) which has provided us with demographic data. Some survey questions provide for structured data. However, much of the quantitative data relies on both semi-structured and deeply-unstructured data. This approach was implemented to enable participants to freely select and articulate their own identity labelling.
Removal of sensitive information (such as names or places of work) has been completed for conversation verbatim.
All quantitative and qualitative data types have been manually assessed and categorised for analysis. Additionally, research support has been provided by the University of Waikato and its ‘Capturing the Diversity Dividend of Aotearoa New Zealand’ project. The resulting Literature Review is referenced within the analysis in this report.
Research tools
- Conversation queries: verbatim capture by note takers in raw format
- Demographic data gathering: manual entry and SurveyMonkey online survey tool
- Website survey incorporating demographic and conversation queries
- Data analysis: manual theming, excel and Tableau
- Literature Review: ‘Diversity, Belonging and Inclusion in Aotearoa New Zealand: a review of consultation and community engagement’.
-
From February to September 2020, Inclusive Aotearoa Collective Tāhono (IACT) engaged with a wide range of people across Aotearoa New Zealand to discuss their feelings of belonging. Participants were found through a range of avenues to reflect the population's diversity. IACT visited forty-six locations for in-person conversations, and further discussions occurred online due to Covid-19 related restrictions.
Despite good planning, there were some limitations to the conversations we held. Here are the details.
Issues with how we collected data around gender
We want to acknowledge there are issues with the way we asked participants about and collected data about their gender. We are now aware our approach was not appropriate and we understand that using these may have caused harm.
When we asked people to share their gender, the options we provided were not in line with good practice around data collection. The options we provided were ‘Male’, ‘Female’, ‘Other’, and ‘Prefer not to respond’. These options do not reflect the diversity of gender identities and expression. This approach excluded and othered people who have diverse sex characteristics by only providing options relating to binary sex characteristics and "Other".
As a result of this, we have changed our practices around collecting information around gender identity and sex characteristics. Please get in contact with our team if you’d like to learn more about this
Representation
- The majority (70%) of volunteer respondents identified as female - this is despite efforts to reflect better gender balance.
- The number of people attending Auckland's conversations were disproportionately smaller than the rest of Aotearoa New Zealand. This is primarily a result of Covid 19 restrictions, notably the second Auckland lockdown. There were also participants who previously lived in Auckland, though this is not reflected in the quantitative data.
Theming and presentation of qualitative data
- The way that qualitative data has been allocated to theme and sub-theme is subjective. Care has been taken to theme data appropriately based on knowledge of the broader context of participants. Note that some responses fit multiple themes and sub-themes.
- Due to the number of responses, the majority of participants' responses are not included on this website and in the report. This does not minimise the importance of excluded responses, and the full data set is stored securely by IACT for supporting the Constellations. To access this data, send us a request through the contact form
- Qualitative data are presented as verbatim to ensure the integrity of responses. However, some data has been amended to anonymise participants' identity.
- None of the responses have been fact-checked and are included as the participant relayed them. They do not reflect the opinion of IACT.
Who spoke to us
| Rohe / Region | Number of participants |
|---|---|
| Te Tai Tokerau / Northland | 142 |
| Tāmaki-makau-rau / Auckland | 106 |
| Waikato | 116 |
| Te Moana-a-Toi / Bay of Plenty | 53 |
| Te Tai Rāwhiti / Gisborne | 12 |
| Te Matau-a-Māui / Hawke's Bay | 21 |
| Taranaki | 5 |
| Manawatū-Whanganui | 20 |
| Te Whanga-nui-a-Tara / Wellington | 92 |
| Te Tai-o-Aorere / Tasman | 20 |
| Whakatū / Nelson | 28 |
| Te Tauihu-o-te-waka / Marlborough | 17 |
| Te Tai Poutini / West Coast | 33 |
| Waitaha / Canterbury | 83 |
| Ōtākou / Otago | 88 |
| Murihiku / Southland | 18 |
| Face-to-face hui | 563 |
|---|---|
| On video calls | 148 |
| Online survey | 149 |
-
73%
Between 25 and 65 years of ageWe asked participants to share their age with us. We did it to recognise age-related discrimination.
Breakdown of participants age Age Number of participants 15 to 25 years 82 25 to 65 years 627 Over 65 years 124 Prefer not to say 27 -
70%
Identified as femaleWe want to acknowledge there are issues with the way we asked this question and the options we provided for answering it. This approach was not appropriate and we understand it may have caused harm. We have changed our practices around collecting information around gender identity and sex characteristics. This is addressed in more detail in the limitations.
Breakdown of participants gender Gender Number of participants Female 603 Male 214 Prefer not to say 32 Other (please share) Participants identified as:- Non-binary (6)
- Transgender (2)
- Irakore/agender (1)
- Pronouns: they/them (1)
- Transmasculine/Questioning (1)
- Female/other (1)
- Although I consider myself male, given the context I want to note my transgender status (1)
10 -
77
Ethnicities and culturesWe asked participants to list the ethnicities or cultures they identify with. This was an optional question. Participants could use their own labelling, and provide multiple responses. As such, one participant may have provided more than one answer to this question. The results are shown in alphabetical order.
Breakdown of participants ethnicity / culture Ethnicity / Culture Number of participants African 14 American 31 Armenian 1 Asian 27 Australian 14 British 17 Canadian 10 Caucasian 3 Chilean 1 Chinese 19 Colombian 1 Cook Island Maori 3 Cook Islander 4 Croatian 2 Danish 3 Dutch 12 English 15 European 215 European Asian 1 Fijian 8 Filipino 12 French 4 French Canadian 1 German 8 Hungarian 1 Indian 42 Iraqi 2 Irish 23 Israeli 3 Italian 3 Jewish 7 Kiwi 21 Korean 3 Latin American 19 Malay 7 Malayali 2 Mestizo 1 Mexican 4 Middle Eastern 11 Moroccan 1 Muslim 4 Muslim-Indian 2 NZ European 132 NZ Indian 2 NZ Maori 58 Nepali-Bhutanese 15 New Zealander 87 Niuean 5 North American 1 Pakeha 165 Pakistan 8 Papua New Guinea 1 Polish 1 Portugese 4 Romani 6 Romanian 2 Samoan 21 Scandinavian 2 Scottish 17 Singaporean 2 Somalian 2 South African 5 South American 3 South Asia 5 South East Asian 5 South Indian 1 Spanish 3 Sri Lankan 13 Sri Lankan Tamil 9 Swiss 2 Tahitian 1 Thai 2 Tokelau 1 Vietnamese 1 West Asia 1 No answer / prefer no to disclose 72 -
52
CountriesParticipants identified themselves with a specific country. These are listed alphabetically below.
- Afghanistan
- Armenia
- Australia
- Azerbaijan
- Bhutan
- Canada
- Chile
- China
- Colombia
- Cook Islands
- Croatia
- Denmark
- Fiji
- France
- French Polynesia
- Germany
- Hungary
- Independent State of Samoa
- India
- Iran
- Iraq
- Ireland
- Israel
- Italy
- Japan
- Mexico
- Morocco
- Nepal
- Netherlands
- New Zealand
- Niue
- Pakistan
- Papua New Guinea
- Philippines
- Poland
- Portugal
- Romania
- Singapore
- Somalia
- South Africa
- Spain
- Sri Lanka
- Sweden
- Switzerland
- Thailand
- Tonga
- Turkey
- United Kingdom
- United States of America
- Vietnam
How it lines up with other data
The communities of New Zealand are incredibly diverse – and within every community itself there is even more diversity and difference. What these communities share in common is the desire to have a society that is inclusive and provides belonging for all.
We asked a team of researchers to help us understand what work has been done before in our country around diversity, belonging and inclusion. The Capturing the Diversity Dividend of Aotearoa New Zealand research project at the University of Waikato put together a review of all of this research.


